Overview
What is data visualization?
Data visualization is the graphical representation of information and data. By using visual elements like charts, graphs, and maps, data visualization tools provide an accessible way to see and understand trends, outliers, and patterns in data. Additionally, it provides an excellent way for employees or business owners to present data to non-technical audiences without confusion.
In the world of Big Data, data visualization tools and technologies are essential to analyze massive amounts of information and make data-driven decisions.
Data is only as good as how well you can communicate what it means. Charts and graphs should make the information clear. If you select the wrong chart type, you can either confuse the audience or lead to mistaken data interpretation. Before you create another presentation, make sure you choose the accurate type of chart to clearly communicate your information.
What are the advantages and disadvantages of data visualization?
Something as simple as presenting data in graphic format may seem to have no downsides. But sometimes data can be misrepresented or misinterpreted when placed in the wrong style of data visualization. When choosing to create a data visualization, it’s best to keep both the advantages and disadvantages in mind.
Advantages
Our eyes are drawn to colors and patterns. We can quickly identify red from blue, and squares from circles. Our culture is visual, including everything from art and advertisements to TV and movies. Data visualization is another form of visual art that grabs our interest and keeps our eyes on the message. When we see a chart, we quickly see trends and outliers. If we can see something, we internalize it quickly. It’s storytelling with a purpose. If you’ve ever stared at a massive spreadsheet of data and couldn’t see a trend, you know how much more effective a visualization can be.
Some other advantages of data visualization include:
- Easily sharing information.
- Interactively explore opportunities.
- Visualize patterns and relationships.
Disadvantages
While there are many advantages, some of the disadvantages may seem less obvious. For example, when viewing a visualization with many different datapoints, it’s easy to make an inaccurate assumption. Or sometimes the visualization is just designed wrong so that it’s biased or confusing.
Some other disadvantages include:
- Biased or inaccurate information.
- Correlation doesn’t always mean causation.
- Core messages can get lost in translation.
Why data visualization is important?
The importance of data visualization is simple: it helps people see, interact with, and better understand data. Whether simple or complex, the right visualization can bring everyone on the same page, regardless of their level of expertise.
It’s hard to think of a professional industry that doesn’t benefit from making data more understandable. Every STEM field benefits from understanding data—and so do fields in government, finance, marketing, history, consumer goods, service industries, education, sports, and so on.
While we’ll always wax poetically about data visualization (you’re on the Tableau website, after all) there are practical, real-life applications that are undeniable. And, since visualization is so prolific, it’s also one of the most useful professional skills to develop. The better you can convey your points visually, whether in a dashboard or a slide deck, the better you can leverage that information. The concept of the citizen data scientist is on the rise. Skill sets are changing to accommodate a data-driven world. It is increasingly valuable for professionals to be able to use data to make decisions and use visuals to tell stories of when data informs the who, what, when, where, and how.
While traditional education typically draws a distinct line between creative storytelling and technical analysis, the modern professional world also values those who can cross between the two: data visualization sits right in the middle of analysis and visual storytelling.
Data visualization and big data
As the "age of Big Data" kicks into high gear, visualization is an increasingly key tool to make sense of the trillions of rows of data generated every day. Data visualization helps to tell stories by curating data into a form easier to understand, highlighting the trends and outliers. A good visualization tells a story, removing the noise from data and highlighting useful information.
However, it’s not simply as easy as just dressing up a graph to make it look better or slapping on the “info” part of an infographic. Effective data visualization is a delicate balancing act between form and function. The plainest graph could be too boring to catch any notice or it make tell a powerful point; the most stunning visualization could utterly fail at conveying the right message or it could speak volumes. The data and the visuals need to work together, and there’s an art to combining great analysis with great storytelling.
General types of visualizations

Charts
Tables
Graphs

Geospatial
- Charts: Information presented in a tabular, graphical form with data displayed along two axes. Can be in the form of a graph, diagram, or map.
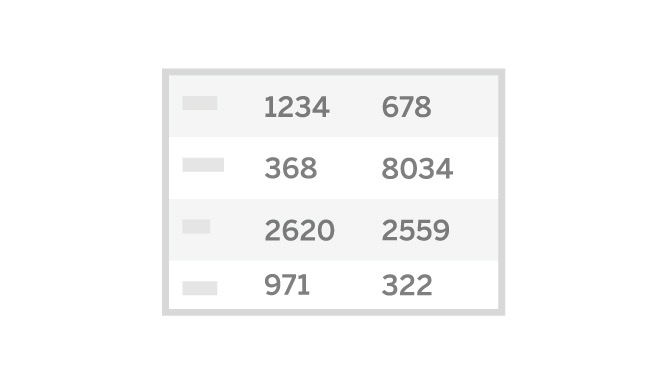
- Tables: A set of figures displayed in rows and columns.
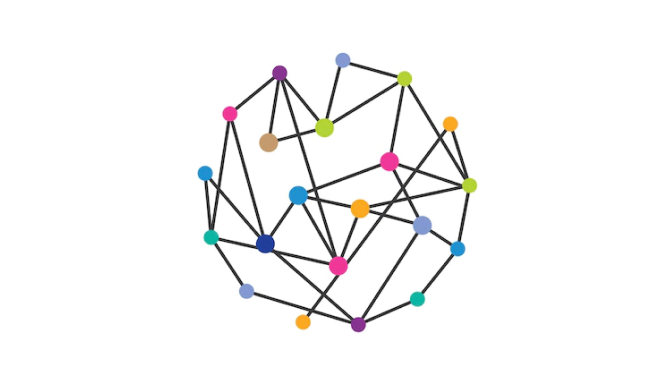
- Graphs: A diagram of points, lines, segments, curves, or areas that represents certain variables in comparison to each other, usually along two axes at a right angle.
- Geospatial: A visualization that shows data in map form using different shapes and colors to show the relationship between pieces of data and specific locations.